
Klarda.com - ETFs Section
The ETFs Page provides key information for trading and analyzing Exchange-Traded Funds (ETFs). Here’s why each metric matters:
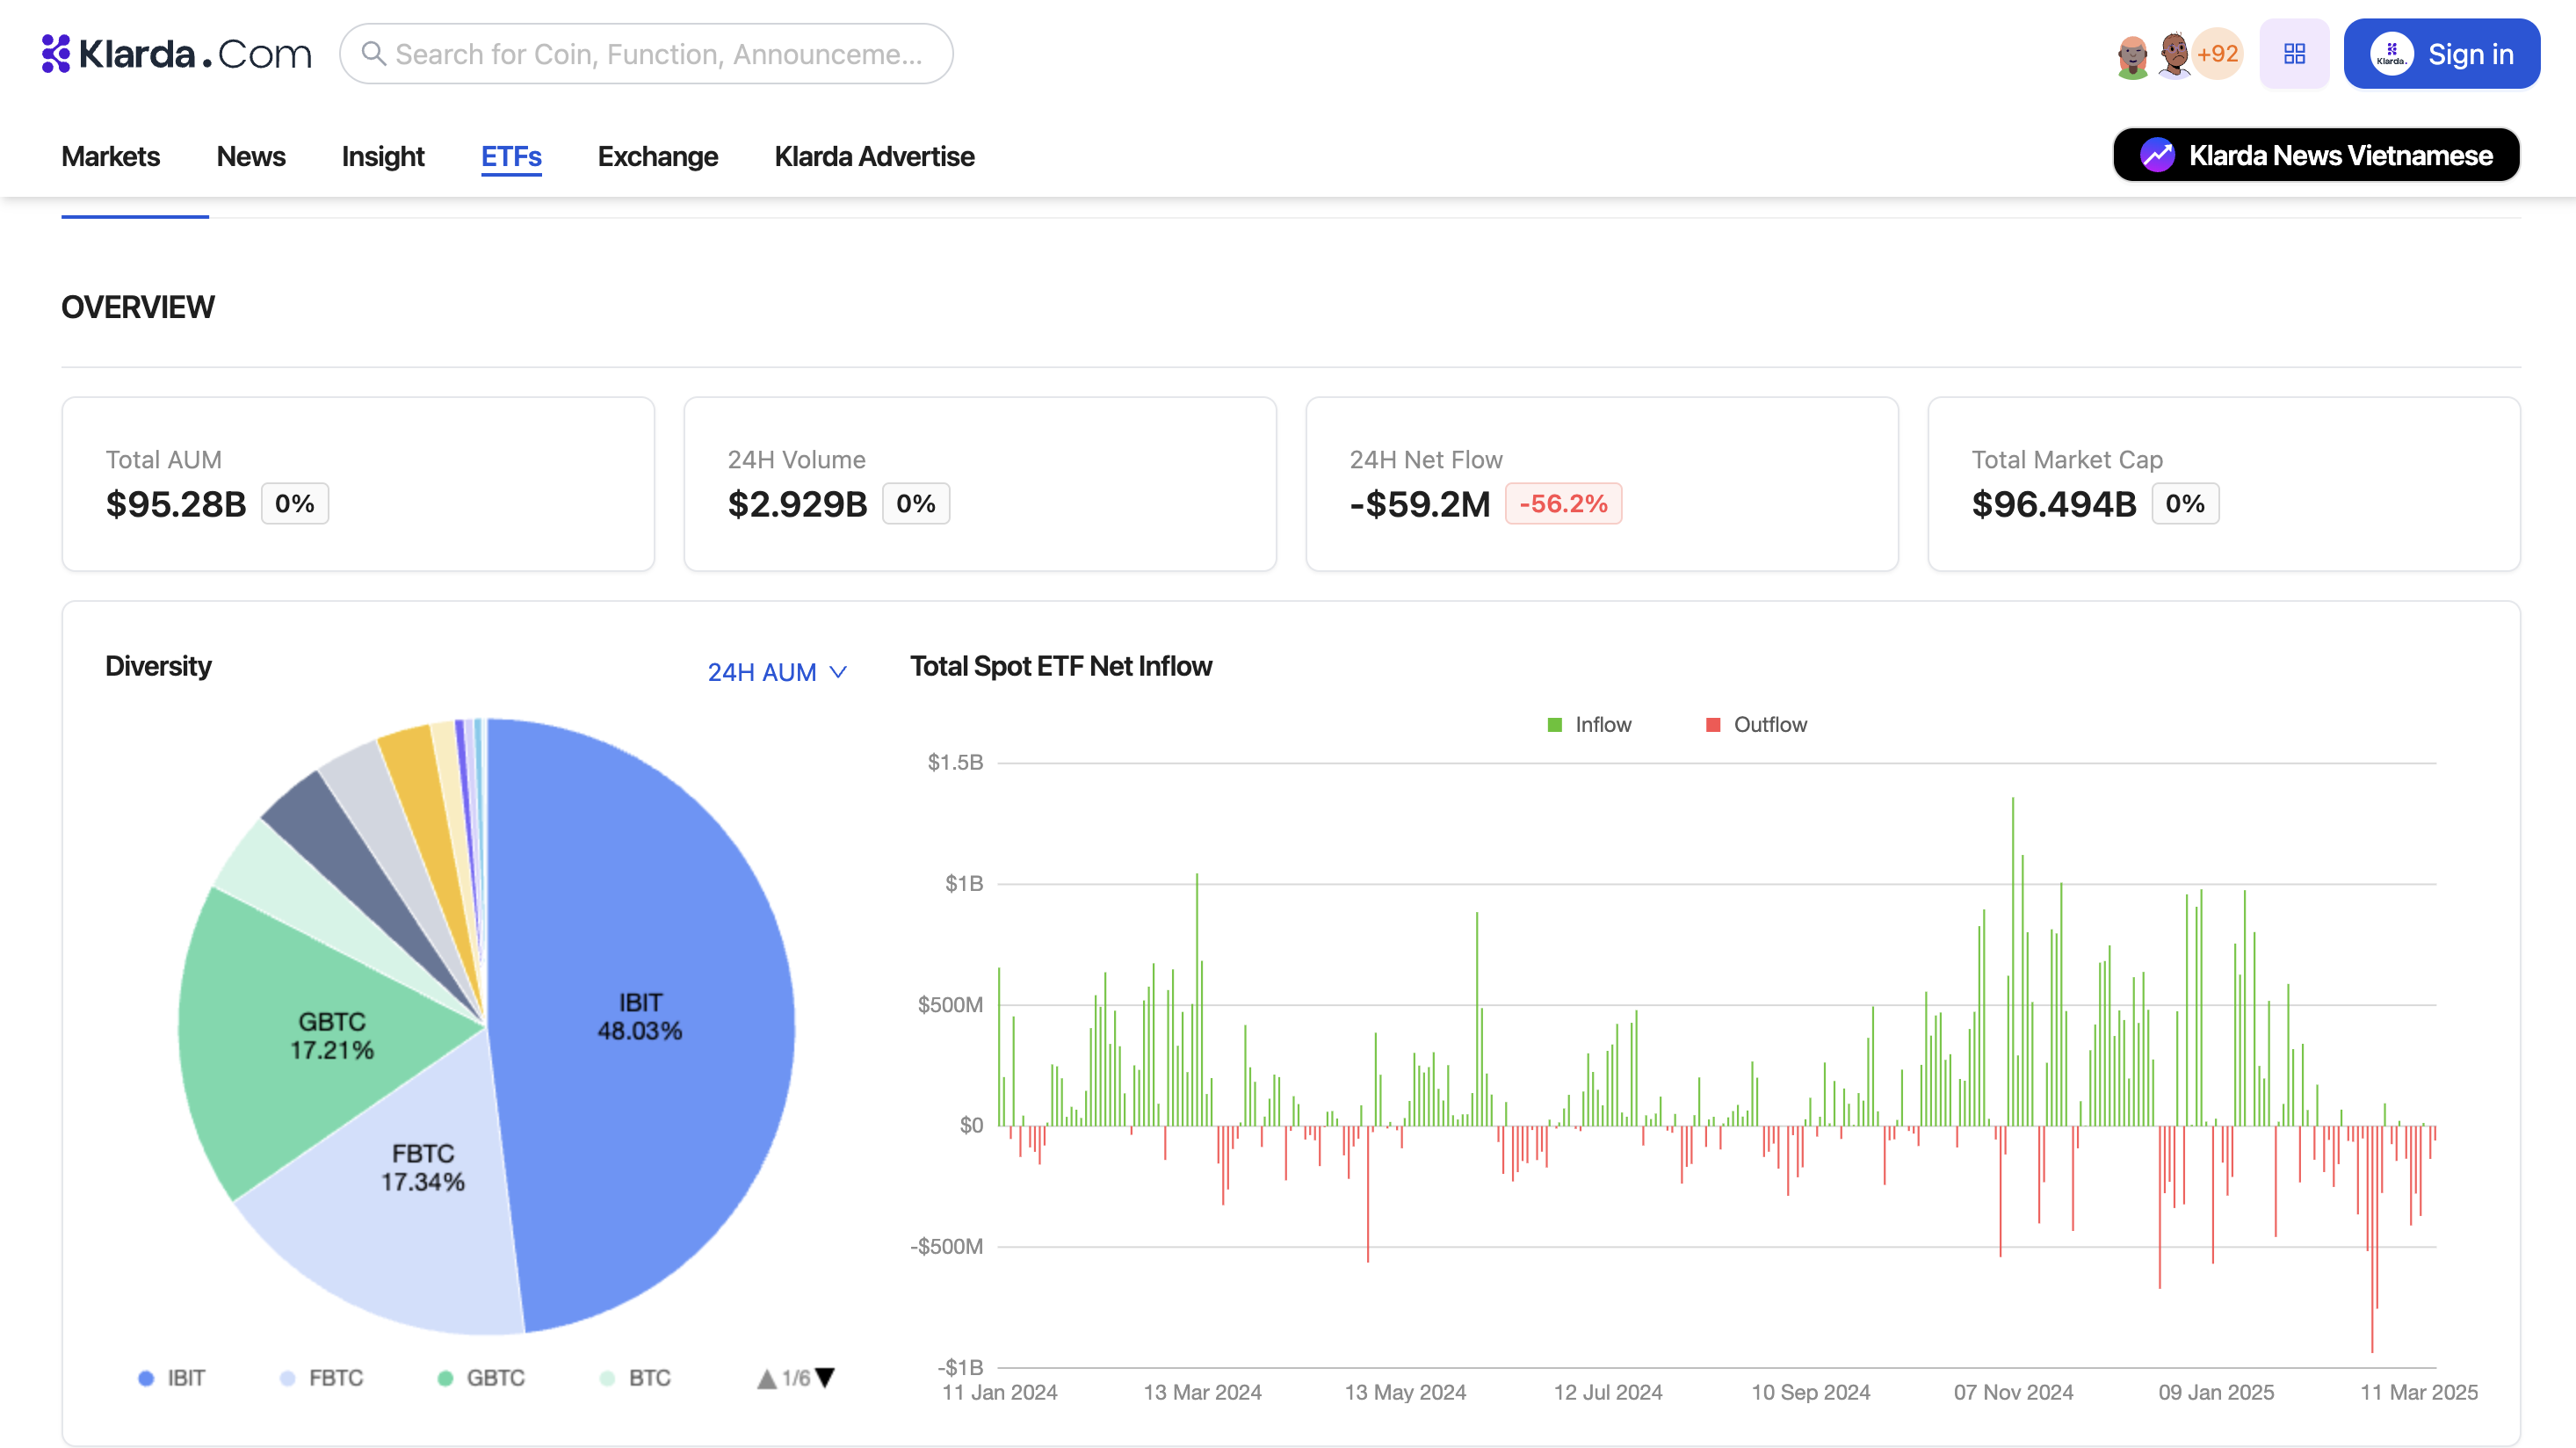
- Total AUM (Assets Under Management)
Represents the total value of assets held within all ETFs.
A higher AUM indicates strong investor confidence and liquidity, making it easier to enter and exit positions. - 24H Volume
Shows the total trading volume of ETFs in the last 24 hours.
High trading volume suggests strong market interest and can indicate short-term price momentum. - 24H Netflow
Measures the net change in ETF capital over 24 hours (inflows minus outflows).
Positive netflow suggests more investors are buying, while negative netflow signals selling pressure. - Total Market Cap
Represents the combined market value of all ETFs.
Helps gauge the overall size and influence of the ETF sector in the broader financial market. - Diversity
Measures the variety of assets within ETF portfolios.
A well-diversified ETF reduces risk by spreading exposure across multiple assets. - Inflow & Outflow Chart
Provides a visual representation of capital entering and leaving ETFs over time.
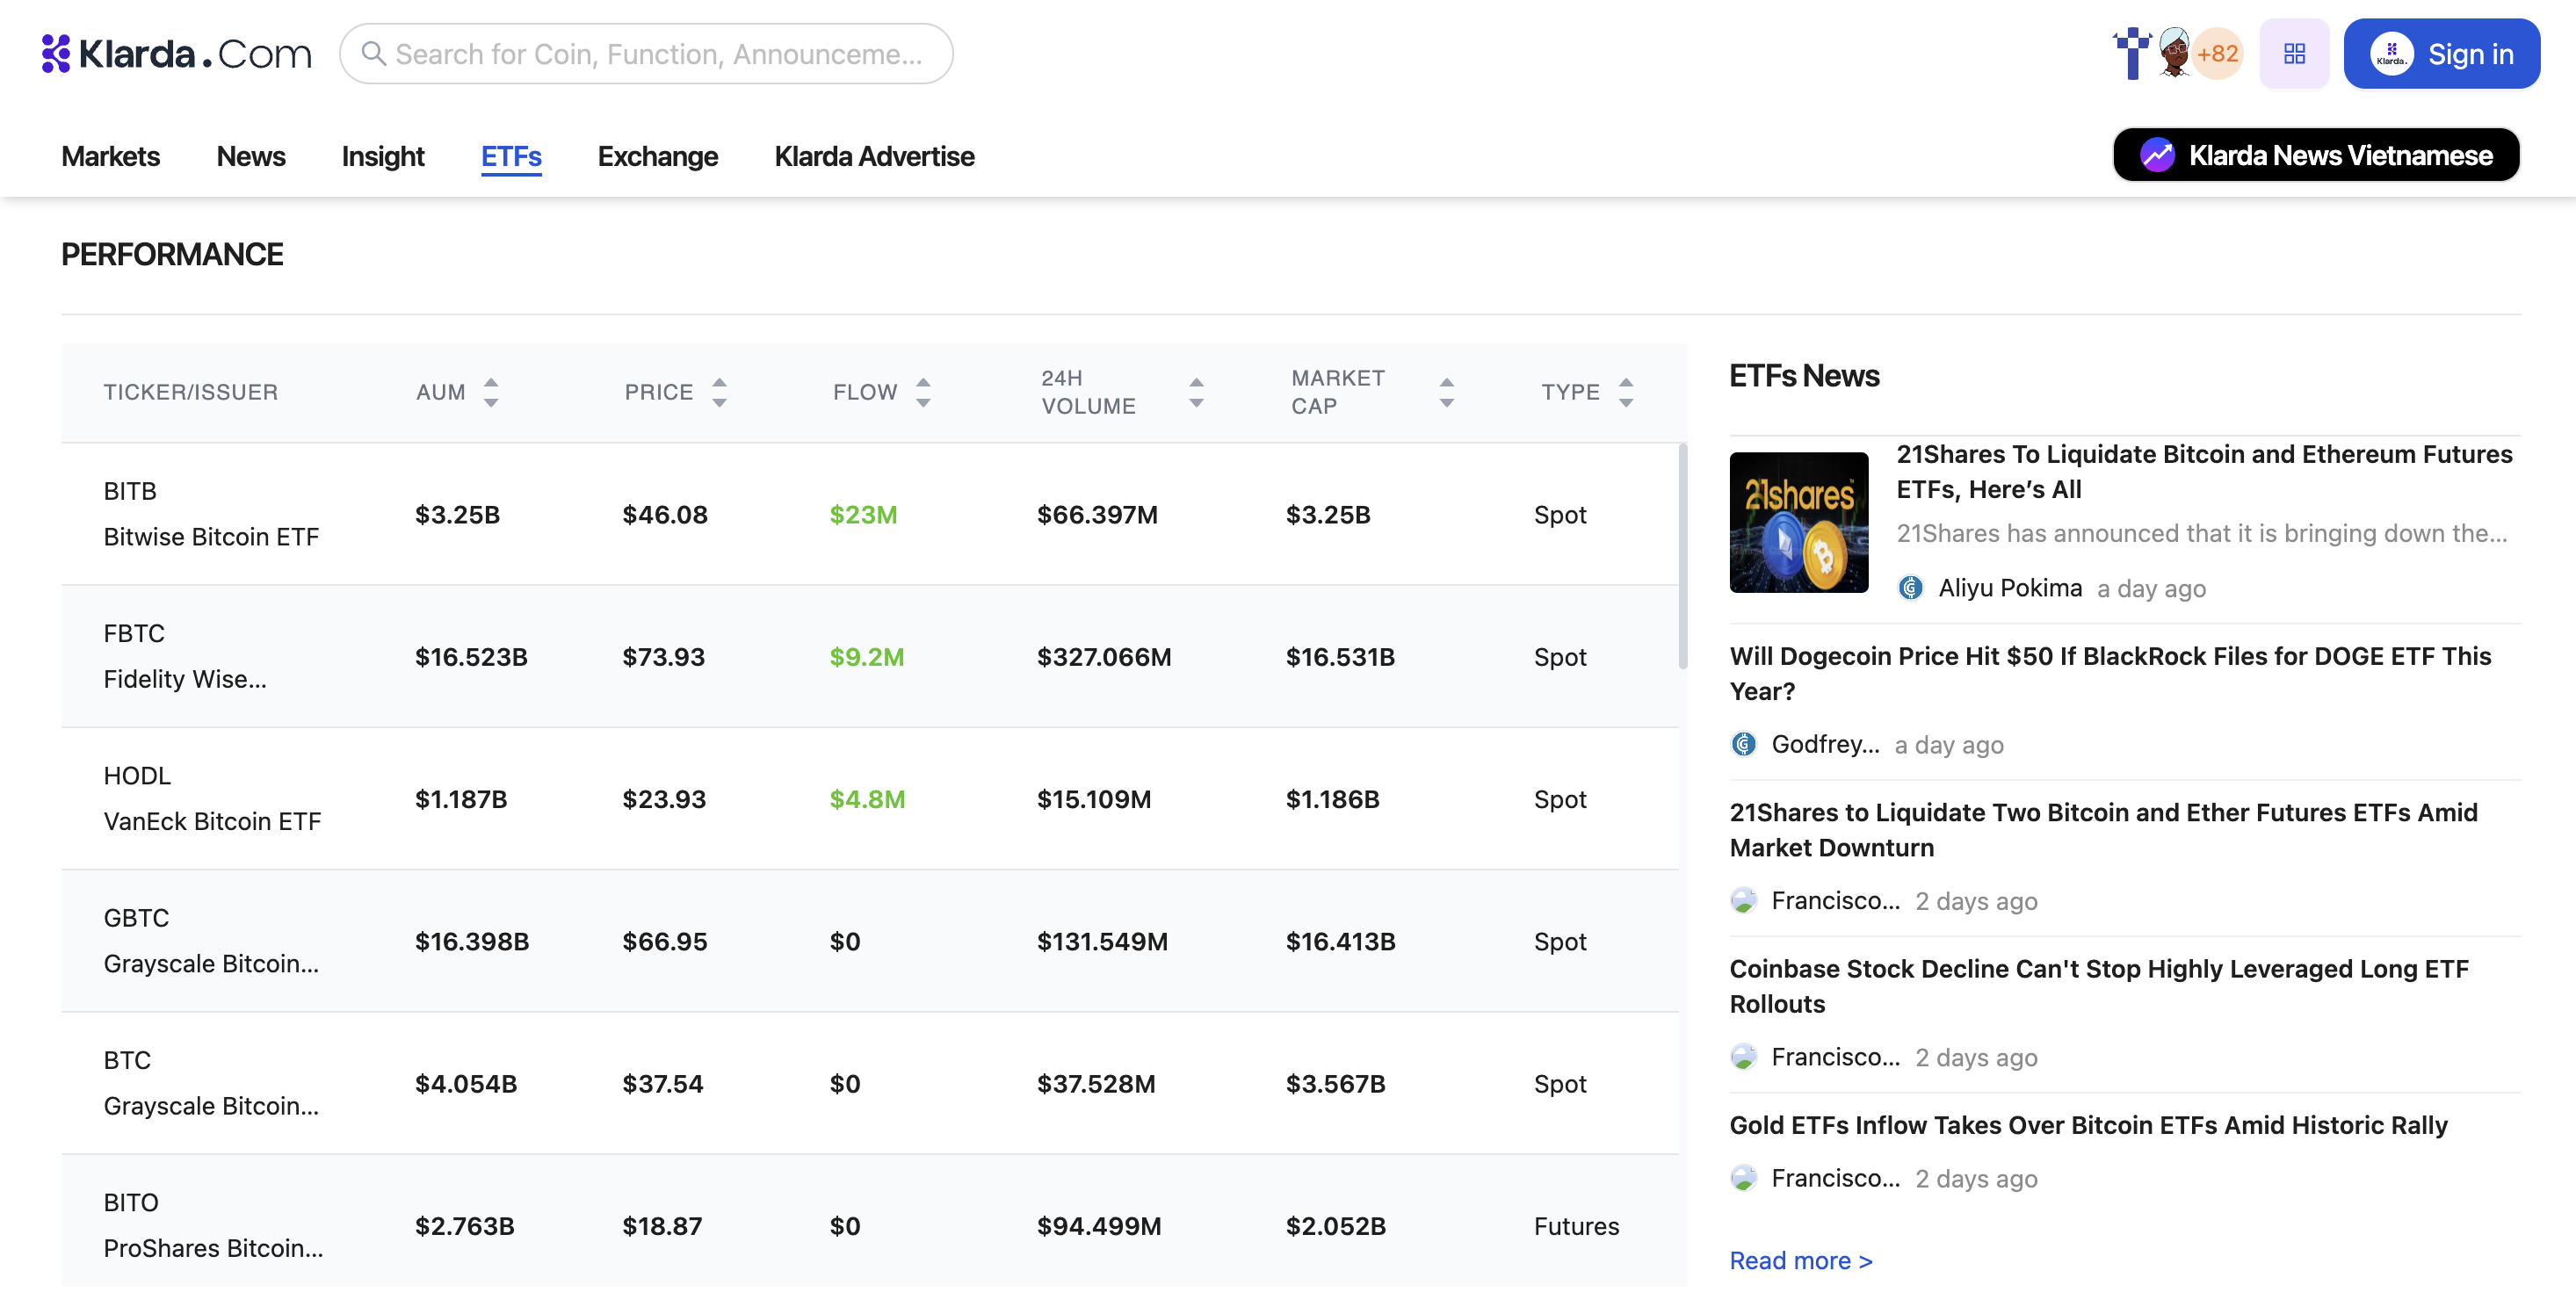
Helps traders identify trends in institutional and retail investor sentiment. - Performance by Company
Tracks the performance of ETFs managed by different companies.
Allows investors to compare fund managers and their historical returns. - ETFs News
Keeps you updated on regulatory changes, fund launches, market trends, and macroeconomic factors affecting ETFs.
Essential for making informed investment decisions based on market conditions.
By analyzing these key indicators, investors can better understand ETF market movements, identify trends, and make data-driven decisions.
Updated about 1 year ago
Did this page help you?